


UsefulChem on ManyEyes
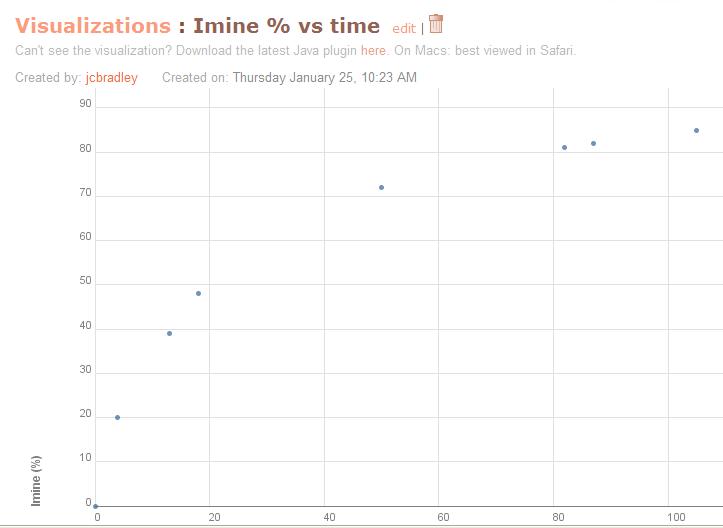
There has been some discussion lately on using free and hosted services for scientific data. On an Element List post Swivel was mentioned. Deepak commented on that post about ManyEyes and I put up some of our data from EXP046 on the imine formation and last step in the Ugi reaction. Here is a sample scatter plot.
1) One limitation of Swivel is that the original data is not available, only the plots. ManyEyes does not have that limitation.
2) As I have done above, it is possible to link to specific views or data in ManyEyes but the user can quickly run a different visualization on the fly just by picking a graph type and variable. This is really where I see the usefulness - that it should be possible to quickly get new insights on experiments by viewing the relationships between variables that one would normally not bother to plot and upload.
3) Make sure to create a dummy first column called something like observations - ManyEyes does not include the first column in the list of variables.
4) It is possible to show the relationship of 3 variables - x, y and point size.
5) Scatter plots do not currently allow multiple lines, trendline calculation or zooming in - that would be really useful.
posted by Jean-Claude Bradley @ Thursday, January 25, 2007
2 comments
![]()

2 Comments:
Jean-Claude,
I noticed you mentioned Swivel in your post. Sorry you couldn't find the links to the original data, we'll make sure we make that more obvious. It's one of our core principles to make all data in Swivel as accessible as possible. The original uploaded file is linked at the bottom left of every data set page. Also, when you look at a graph, a tab below the graph on the right lets you switch to table view of the exact data shown on the graph, and there's a link to download a CSV file of it.
Also, we have the same limitation where you need a dummy column if all you have is a single column of measurements, to get a scatterplot, nor do we do trend fitting yet.
I'd love to hear any other feedback you have, just drop a comment into the feedback box (link above the search box on Swivel).
Thank you,
Dmitry Dimov
Product Chief & Cofounder
http://www.swivel.com
Dmitry,
Thanks for pointing out how the original data can be found. I uploaded the same data in Swivel to further compare but I can't find how to reproduce the same types of plots that I made in ManyEyes, with or without a dummy column. Can you show me how?
Post a Comment
<< Home