


Chemical Information Validation Results from Fall 2010
As I mentioned earlier, one of the outcomes from my Fall 2010 Chemical Information Retrieval class involved the collection of chemical property information from different sources in a database format. Now that the course is over, this has resulted in 567 measurements for 24 compounds (including one compound EGCG from the previous term). I have curated the dataset to ensure that the original numbers, conversions to common units, categorizations, etc. are correct. Links to the information source or to a screenshot of the source are available for each entry - so if I missed something, anyone can unambiguously verify it for correction.
The dataset is available from a Google Spreadsheet. Andrew Lang has also created a web based interface: the ChemInfo Validation Explorer. By simply specifying the compound of interest and the property using drop-down menus the list of measurements from the relevant sources is provided with values outside of one standard deviation marked in orange. Links to the information source, or an image in cases where the information source cannot be directly linked, are provided in the results. Here is an example for the boiling point of benzene.
 The visualization and analysis of the data was greatly facilitated by the use of Tableau Public. After downloading the free program anyone can easily re-create the queries in this post by first downloading the dataset as an Excel document then importing into Tableau Public. Interactive charts can then be freely hosted on the TP server and embedded as I have done in this post below.
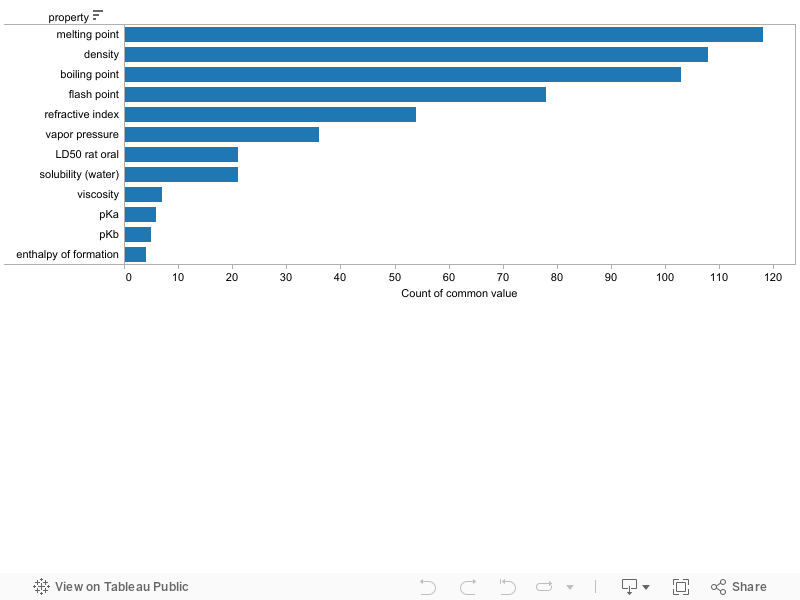
The students were shown how to search both commercial and free information sources and were given complete freedom for which compounds and chemical properties to target. The results can be analyzed from the perspective of a reasonable sampling of the current state of chemical information available to the average chemist. The 5 most frequently obtained properties were melting point, density, boiling point, flash point and refractive index.
The information sources were categorized and are reported below by frequency. Chemical vendor sites were by far the most frequently used information source.
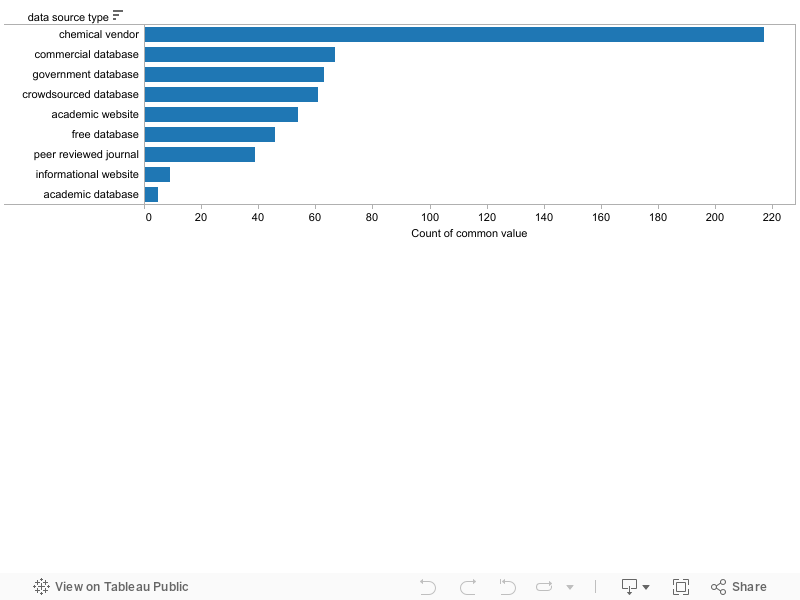
It is important to note that the information source does not represent the method by which the measurements were found. The source is simply the end of the chain of provenance: the document that provides no specific reference for the reported measurement. For example, even though ChemSpider was frequently used as a search engine, it would not be listed as an information source when it provided links to other sources (mainly MSDS sheets) for properties. ChemSpider was treated as a source for some predicted properties.
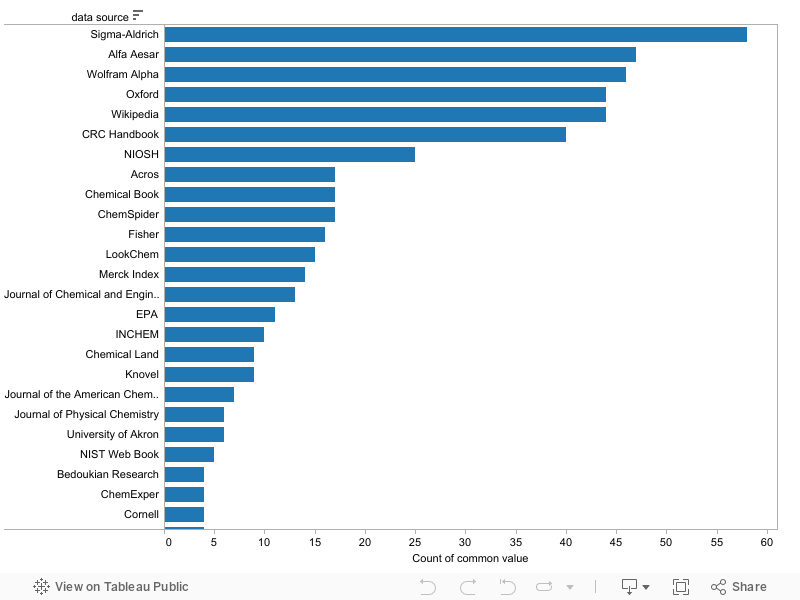
The chemical vendor Sigma-Aldrich was the most frequently used information source, followed by Alfa Aesar. Wolfram Alpha - categorized as a "free database" was third. Oxford University follows closely behind as fourth and is categorized as an "academic website", hosting MSDS sheets. Many universities host MSDS sheets but the Oxford web site seems to turn up most frequently from chemical property queries on search engines.
The fifth most frequent information source was Wikipedia, reflecting the fact that specific references are usually not provided there for chemical properties. Like ChemSpider, Wikipedia was categorized as a "crowdsourced database".
Flagging Outliers
One of the advantages of this type of collection is that it is much easier to identify outliers. In the case of non-aqueous solubility data, we were able to create an outlier bot to automatically flag potentially problematic results. Since different properties may have very different typical variabilities, outliers are most easily discovered by comparisons within the same property.
For example consider the following plot showing the standard deviation to mean ratio for melting point measurements.

This reveals that the average melting point for EGCG is suspect. At this point, an easy way to inspect the results is to use the Validation Explorer and look at the individual measurements.

By clicking on the images we can verify that the numbers have been correctly copied from the primary sources. In this case we can also ascertain that the sources - a peer reviewed paper and the Merck Index - are considered by most chemists to be generally reliable. There is no compelling reason at this point to weigh one result over the other and one has to be careful when using the average value for any practical application. (Note that all temperature data is recorded as Kelvin. A zero-based scale is necessary to ensure that the standard deviation to mean ratio is meaningful.)
The next flagging hit in this collection is the melting point of cyclohexanone. In this case 5 results are returned and the Validation Explorer highlights the Alfa Aesar value as being more than one standard deviation from the average.

However, one has to be careful when assessing this and assuming that the Alfa Aesar value is most likely to being the odd value out. Notice that 3 of the values - Sigma-Aldrich, Acros and Wolfram Alpha are identical. The most likely explanation for this is that all three used the same information source and should thus be counted as a single measurement.

The same is true for boiling points:
 However, in the case of flash points it is clear that the three are not using a common data source.

Using the data we collected - and will continue to collect - we could start to identify which data sources are likely using the same ultimate sources and avoid over-counting measurements. This would save time in searching since one would know which sources to check for a particular property while avoiding duplication. This information is extremely difficult to obtain using other approaches.
The same type of outlier analysis can be performed for all the properties collected in this study.
I believe that there is much more useful analysis to be done on this dataset, especially for chemistry librarians. When this class is run next year, more data will be added. In the meantime, contributions from other sources would be welcome.
This reveals that the average melting point for EGCG is suspect. At this point, an easy way to inspect the results is to use the Validation Explorer and look at the individual measurements.

By clicking on the images we can verify that the numbers have been correctly copied from the primary sources. In this case we can also ascertain that the sources - a peer reviewed paper and the Merck Index - are considered by most chemists to be generally reliable. There is no compelling reason at this point to weigh one result over the other and one has to be careful when using the average value for any practical application. (Note that all temperature data is recorded as Kelvin. A zero-based scale is necessary to ensure that the standard deviation to mean ratio is meaningful.)
The next flagging hit in this collection is the melting point of cyclohexanone. In this case 5 results are returned and the Validation Explorer highlights the Alfa Aesar value as being more than one standard deviation from the average.

However, one has to be careful when assessing this and assuming that the Alfa Aesar value is most likely to being the odd value out. Notice that 3 of the values - Sigma-Aldrich, Acros and Wolfram Alpha are identical. The most likely explanation for this is that all three used the same information source and should thus be counted as a single measurement.
We can test this hypothesis by looking for cases where Sigma-Aldrich, Acros and Wolfram Alpha don't share identical values. As shown below, for melting point measurements, there is no case where the values don't match.

The same is true for boiling points:
 However, in the case of flash points it is clear that the three are not using a common data source.
Using the data we collected - and will continue to collect - we could start to identify which data sources are likely using the same ultimate sources and avoid over-counting measurements. This would save time in searching since one would know which sources to check for a particular property while avoiding duplication. This information is extremely difficult to obtain using other approaches.
The same type of outlier analysis can be performed for all the properties collected in this study.
I believe that there is much more useful analysis to be done on this dataset, especially for chemistry librarians. When this class is run next year, more data will be added. In the meantime, contributions from other sources would be welcome.
posted by Jean-Claude Bradley @ Wednesday, January 05, 2011
9 comments
![]()

9 Comments:
Thanks for am excellent summary, Jean-Claude!
Nice write up indeed! Will read it in detail asap. Please at least upload it to Nature Preceedings, or so...
Thanks Beth and Egon! NP is a good idea - it will take some reformatting to get in pdf, the only format they currently accept. I liked being able to link to the interactive Tableau Public for various charts
Will http://pdfmyurl.com/ work?
Beth that might be a useful site for some applications - in this case it doesn't handle the embedded Tableau Public script. I will have to create images for these manually.
This is a great move forward..I can see a lot of possibilities here that we can discuss at ScienceOnline. One comment...I would not quote MP, FP etc to three decimal places. I think it's the shift to K where you arte introducing the 3 dp. Just round it up...
The indication that some sources show high correlation is interesting. Can you add
a source x source matrix showing all correlation coefficients? This also suggest to take
a weighted mean, down-weighing the suspected duplicated sources. Does that have a big
effect on the detection of outliers?
Have you considered the two sources of EGCG to report melting points of different salts
of the compound? Have students been instructed to look for that?
Egon - we have not yet processed the dataset for identifying likely common sources yet. It will take a bit of coding but should not be too hard.
If you look at the screenshots from the Validation Explorer you can see that the MWs are identical so this can't be a salt issue.
http://showme.physics.drexel.edu/onsc/cir/
Tony - the 3 decimal places for the MP and BP are not meaningful - we just wanted a quick default way of presenting most of the information. We had to go more decimal places because of other properties like density. We are currently not taking into account significant figures in the normalized dataset.
Post a Comment
<< Home